


A wedge pattern is commonly associated with the top or bottom of a trend. It is a pattern formed by trading along straight lines that come together to form a pattern.
In three to four weeks, the wedge should be done. This pattern slows down in the same way, whether it is going up or down.
It is different from a triangle because its boundary lines go up or down. A second difference is made at the point where the price breaks out of the triangle.
Falling and rising wedges are small parts of the major or intermediate trends. Because they are only used for small trends, they are not thought of as major patterns.
As soon as this main or fundamental trend starts up again, the wedge pattern is no longer useful as a technical indicator.
Rising wedge patterns appear on charts when the market makes highs and lows within a contracting range.
Range contraction indicates a weakening uptrend, making this pattern a reversal pattern.
This pattern is bearish because it shows that its correction is losing strength, and the downtrend is about to resume.
The market range also narrows in the correction. Rising wedge boundaries slope left to right. Both lines point in the same direction, but the lower line rises more steeply.
Breaking the lower boundary line usually lowers prices. With each price increase, volumes decline, indicating weakening demand at higher prices.
Rising wedges work better in bearish markets. In a bullish trend, a rising wedge may be a flag or pennant, which takes about four weeks to complete.
When a trend is about to end, a rising wedge pattern will appear. As a result, a bearish reversal should be anticipated as the subsequent move after the formation of the ascending wedge pattern.
When the market moves in a direction that is bearish and falls below the support trend line, this can be taken as confirmation of the bearish reversal.
The market has a tendency to correct itself back to the level where the rising wedge pattern was formed many times.
At the end of a trend, the rising wedge appears. As a result, the next move following the formation of the ascending wedge pattern is a bearish reversal.
A bearish reversal is confirmed when the market moves in the opposite direction of the support trend line.
The market tends to correct itself back to the level that was the starting point for the rising wedge pattern on a number of occasions.
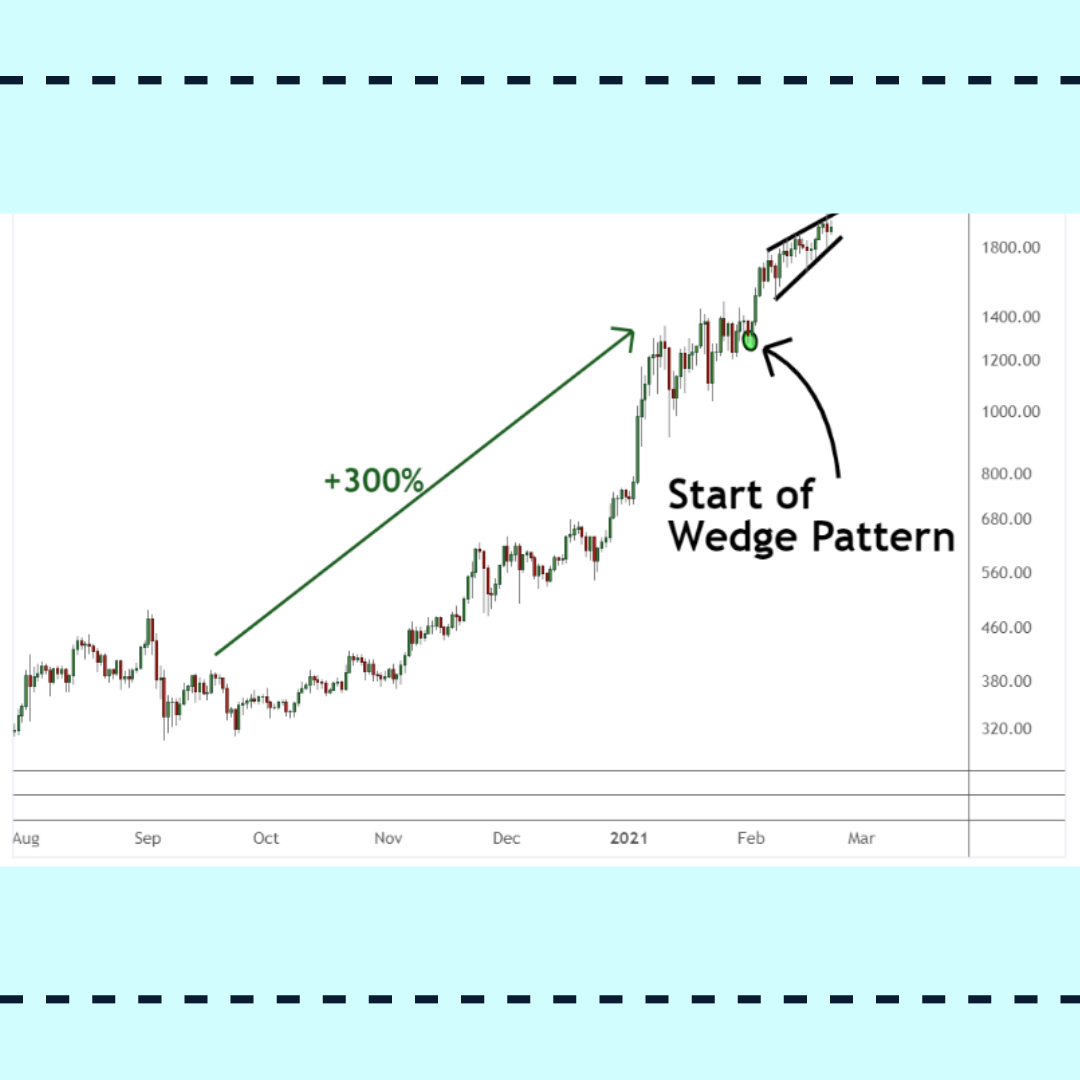
After a long and mature uptrend, the rising wedge pattern appears, signaling a potential reversal.
ETH rocketed from around $300 to $1,300 in a long, strong uptrend from September 2020 to January 2021. The following example contains two illustrations.
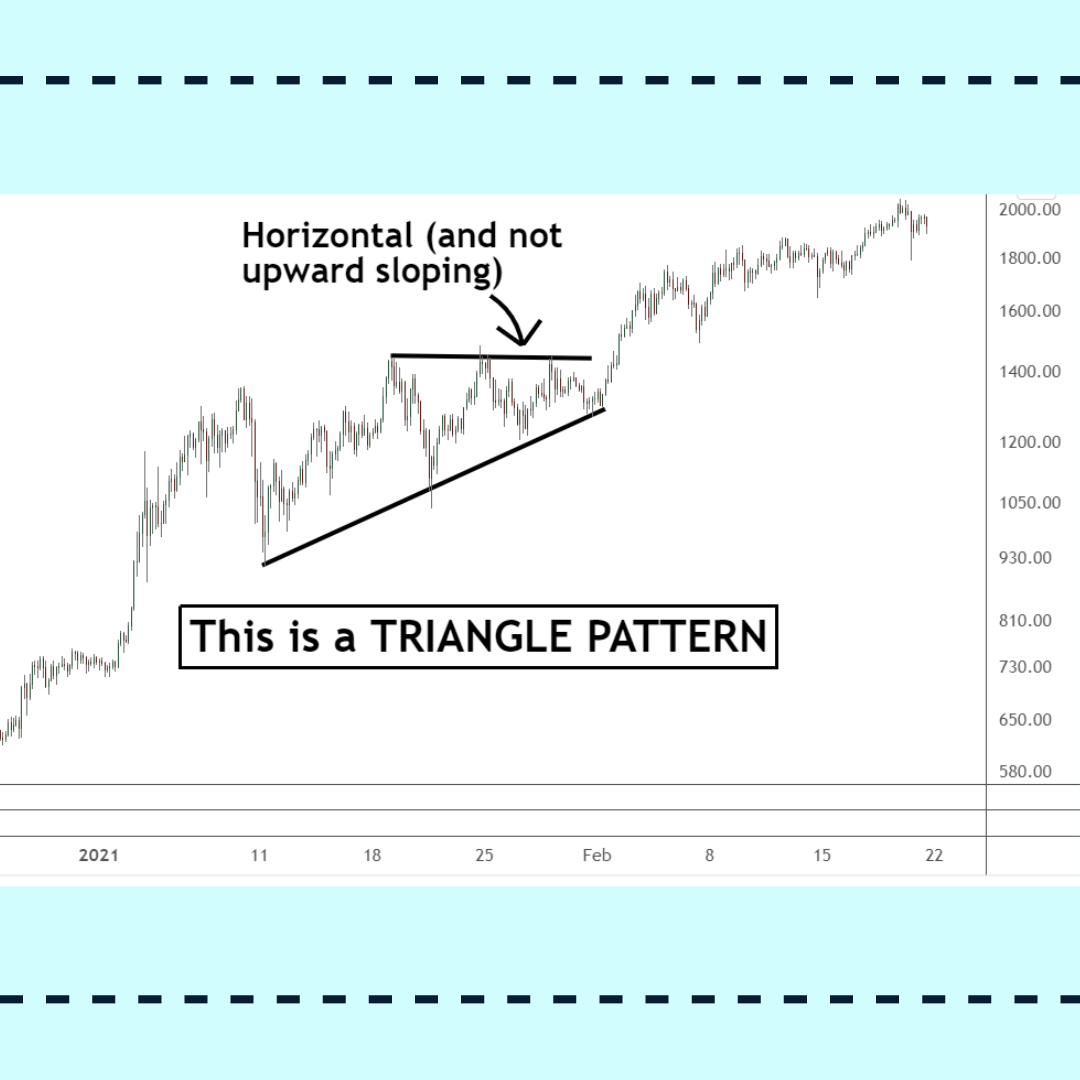
For starters, take note of how the price action turns sideways in late January 2021. This is a triangle pattern with horizontal and ascending trend lines that are converging.
New traders may misinterpret this pattern as a wedge. However, despite its appearance as a wedge, the resistance line is essentially horizontal-to-downward sloping.
This is a clear indication of a continuation triangle pattern rather than a rising wedge. When this pattern is completed, ETH will begin to rally at the beginning of a rising wedge pattern.
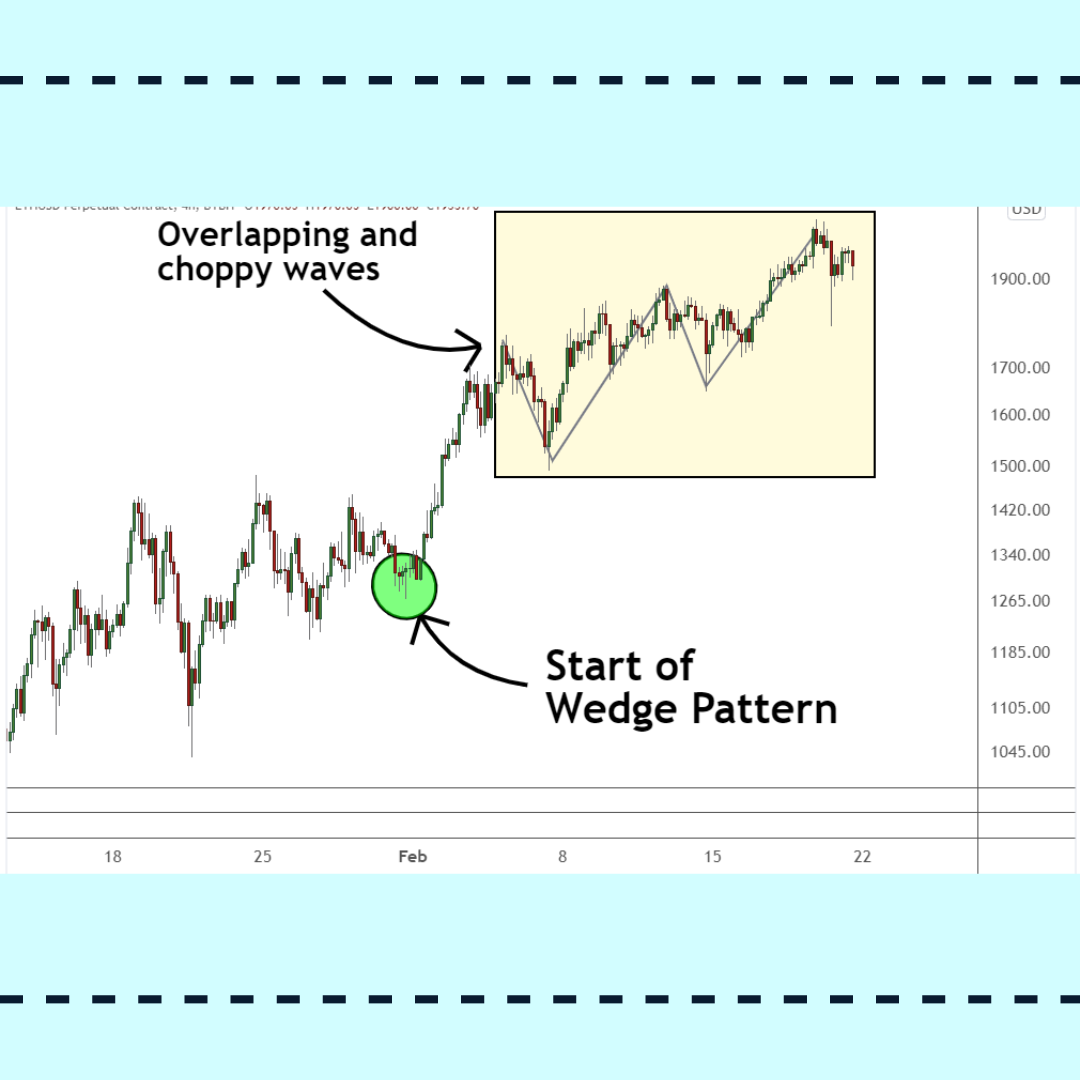
Beginning on January 31, the price of ETH begins to rise in choppy waves — that is, when new highs are formed, they are immediately followed by a corrective trend.
These choppy waves are moving upward but at a slow and overlapping pace. When you see these choppy and overlapping waves, you should add trend lines to the pattern.
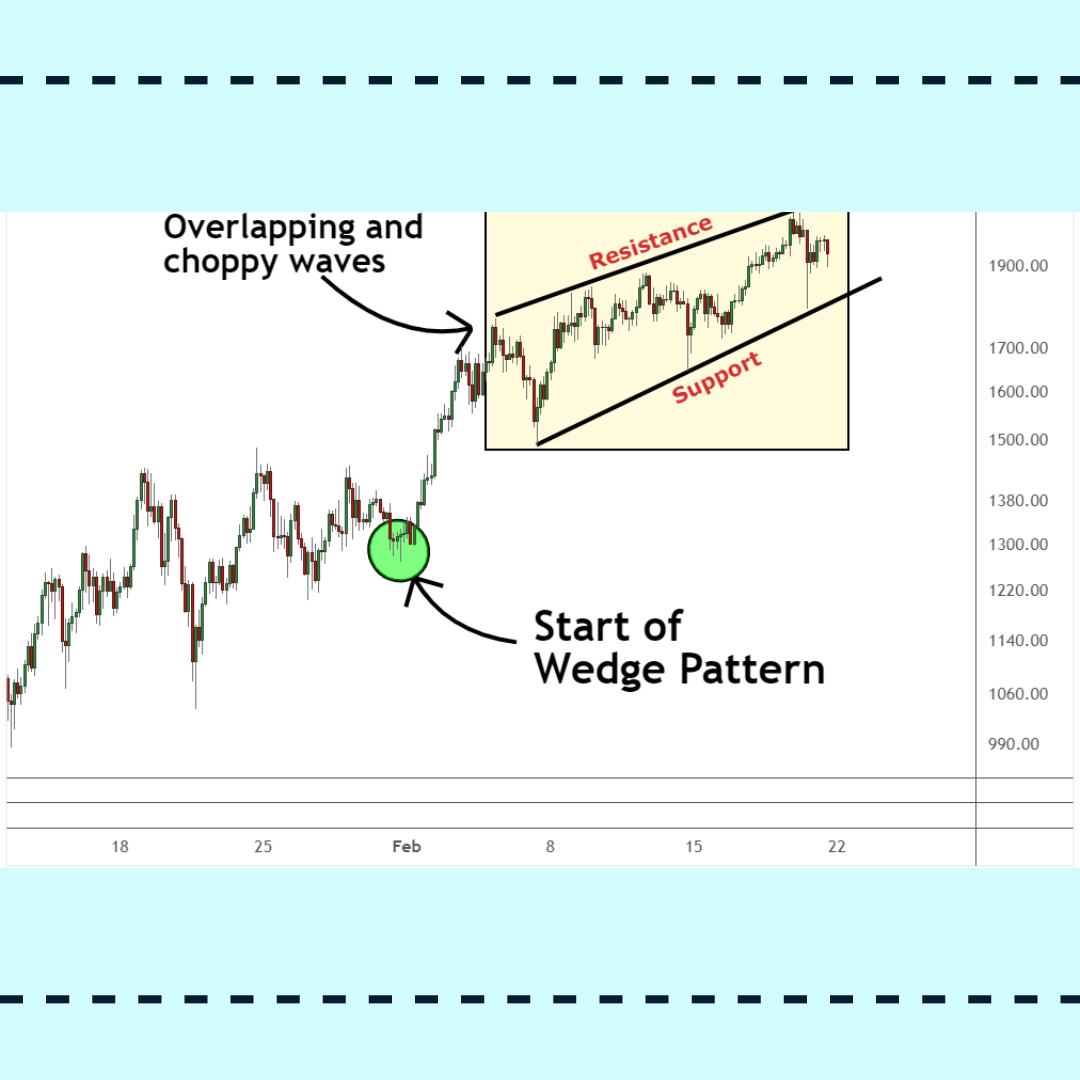
The resistance trend line is drawn to cover the high points of the choppiness. As prices continue to make higher highs, the resistance trend line should slant higher.
If the resistance trend line isn't slanting higher, this isn't a rising wedge pattern, and another pattern is forming.
Once the upward-sloping resistance trend line is in place, the support trend line can be drawn. This is created by connecting the choppiness's low points.
As the pattern stair-steps upward, the support trend line should also slant higher, forming higher lows if the support trend is not angled higher, a pattern other than an ascending wedge forms.
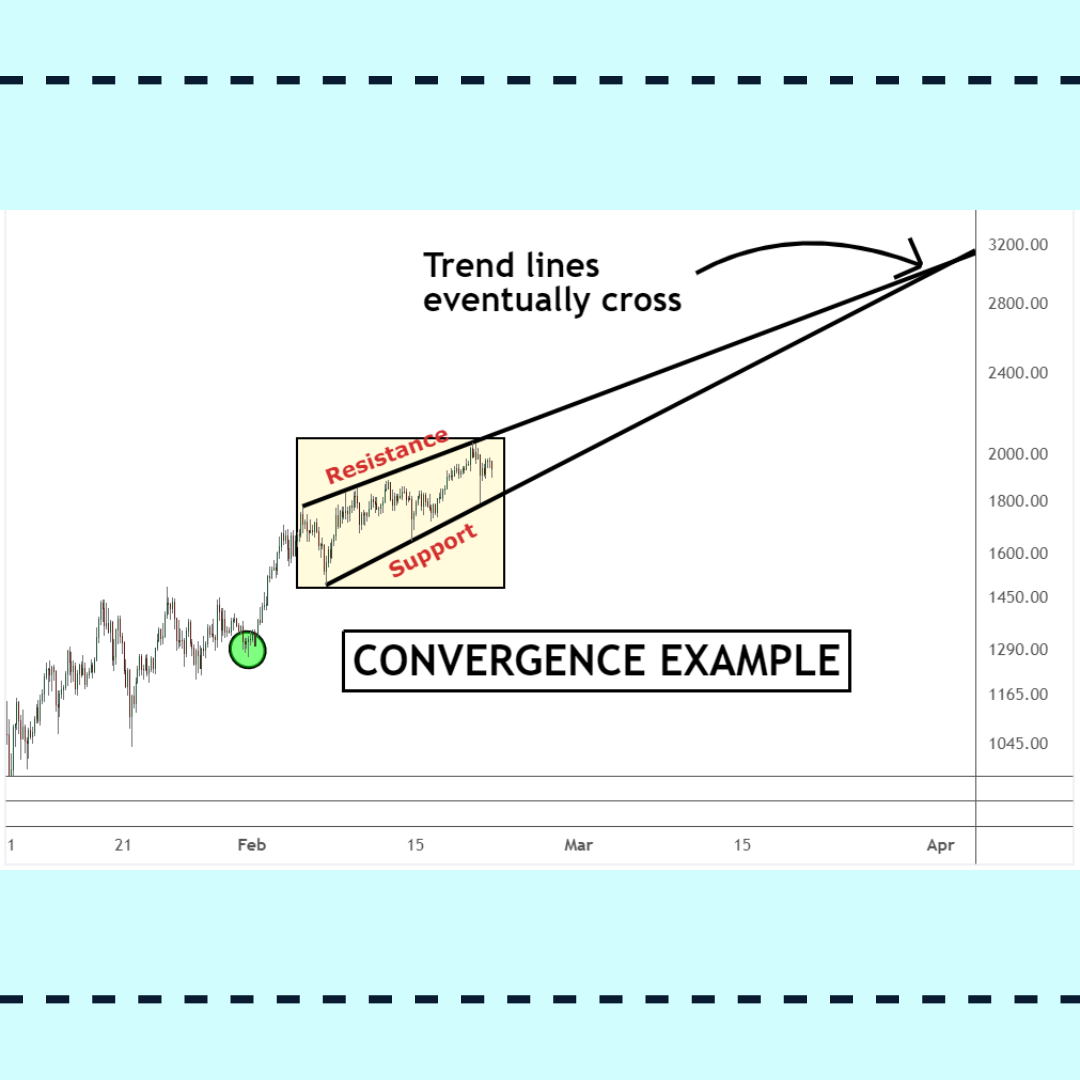
Check to see if the support and resistance lines converge if they are both angled higher. This convergence is more visible at times than others.
Extending each of the trend lines to the right is the simplest way to see if they are converging.
If they cross in the future, they will be converging, forming a rising wedge pattern. If they do not eventually intersect, another pattern will emerge.
Although the rising wedge pattern is popular among traders and technical analysts, it can be difficult to identify in real-time.
In a reversal pattern, the rising wedge is frequently confused with the triangle pattern, which is a continuation formation.
The clear entry and exit signals provided by the ascending wedge pattern make the rising wedge pattern ideal for traders looking to short the market or manage their long-term HODL positions.
|
HOT TOPICS |
|
 |
|
 |
|
 |
How Should You Trade The GBP/USD On October 14th? Simple Pointers For Newcomers |


 AssetsFX