


The rising wedge pattern is a highly effective strategy for identifying potential trading opportunities. When a stock's price moves between two sloping trend lines drawn like a triangle, it forms a wedge.
Rising wedge patterns are quite common on the stock, futures, and foreign exchange markets, so many day traders probably already know about them. They are the opposite of falling wedge patterns.
As we explain in this blog post, the rising wedge, which is also called an ascending wedge, can be very reliable and has the potential to make huge profits if traded correctly.
A rising wedge is a type of bearish stock pattern that has a large base at the bottom and gradually narrows as prices move higher.
This shows that momentum is slowing, and it usually comes before a turn to the downside. Traders can use this to look for opportunities to sell.
It exhibits a trend line that is unable to break free from the intersection of two intersecting upward-sloping diagonal price trend lines of support and resistance.
The upper line is known as resistance, while the lower line is known as support.
Rising wedges are a sign of a bearish reversal because prices usually go down right after a rising wedge.
On the other hand, falling wedges signal that the prices of securities are going up. A rising wedge is also an example of a continuation.
In this case, it will still go up, but it will go up against the general trend of going down. Rising wedge patterns are always bearish, no matter what type they are (continuation or reversal).
The rising wedge chart pattern is made when a stock moves back and forth between two support and resistance lines that meet in the middle.
In this case, both the support line and the resistance line need to go up, and the support line needs to be steeper than the resistance line.
As already said, rising wedge patterns point to a bearish market. When the wedge lines up with the current trend, it's likely that the market will change direction.
But if the wedge points in the opposite direction of the trend, chances are that the trend will keep going.
For the rising wedge to be a good trading signal, the price should be seen to move in a narrow range, but it doesn't have to be a point.
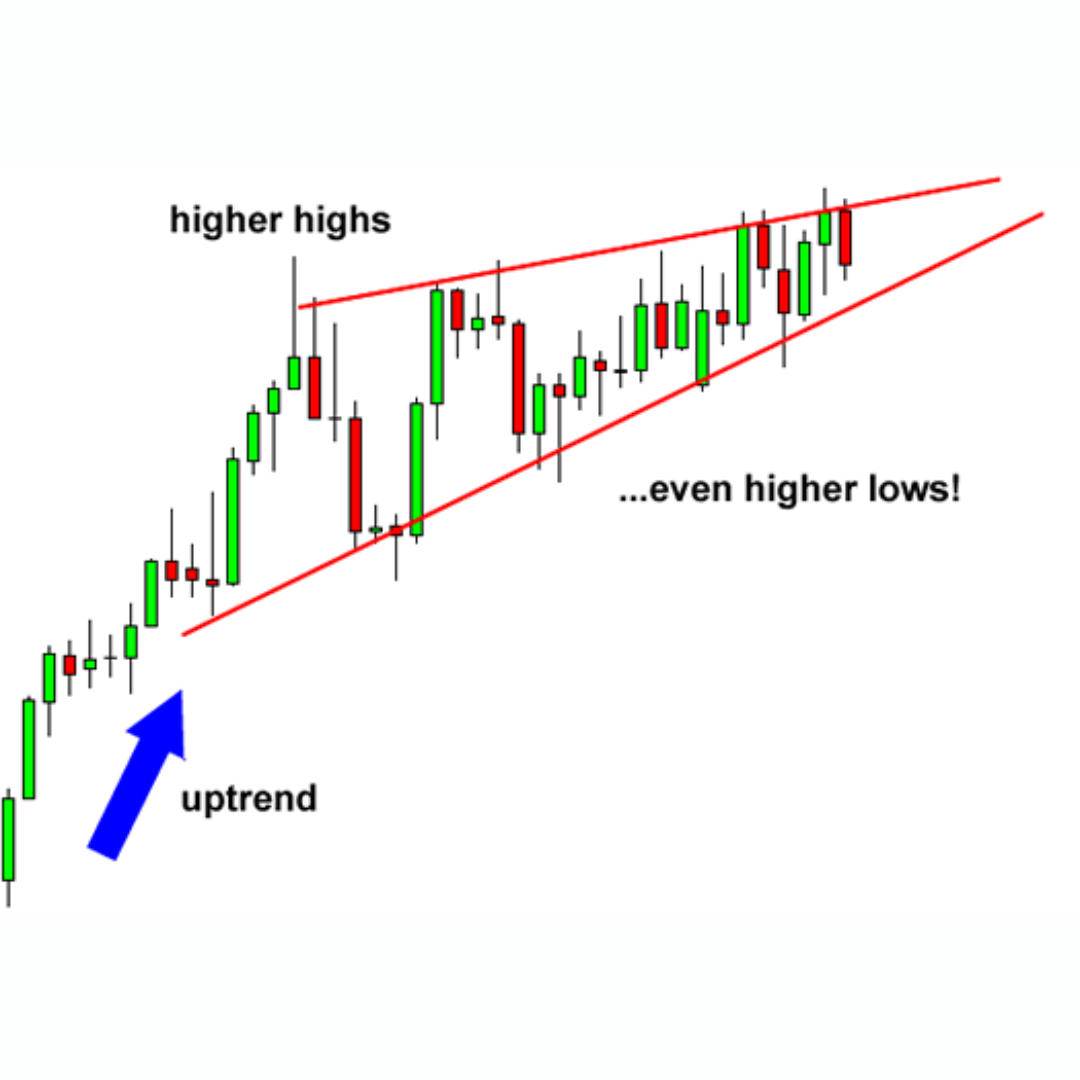
As the wedge forms, the price should move in a saw-tooth pattern with higher lows and higher highs.
Ascending wedges are sometimes one of the hardest chart patterns to trade and spot.
Like most patterns, it's important to wait for a stock to break out and use other technical analysis tools to confirm signals.
In the next section, we'll discuss how to use these chart patterns to your advantage.
When you see this pattern on a stock trading chart, the most important thing to do is to have your entry orders ready. A rising wedge formed in the chart below at the end of an uptrend.
Price action is making new highs, but it is happening much more slowly than when the price makes higher lows.
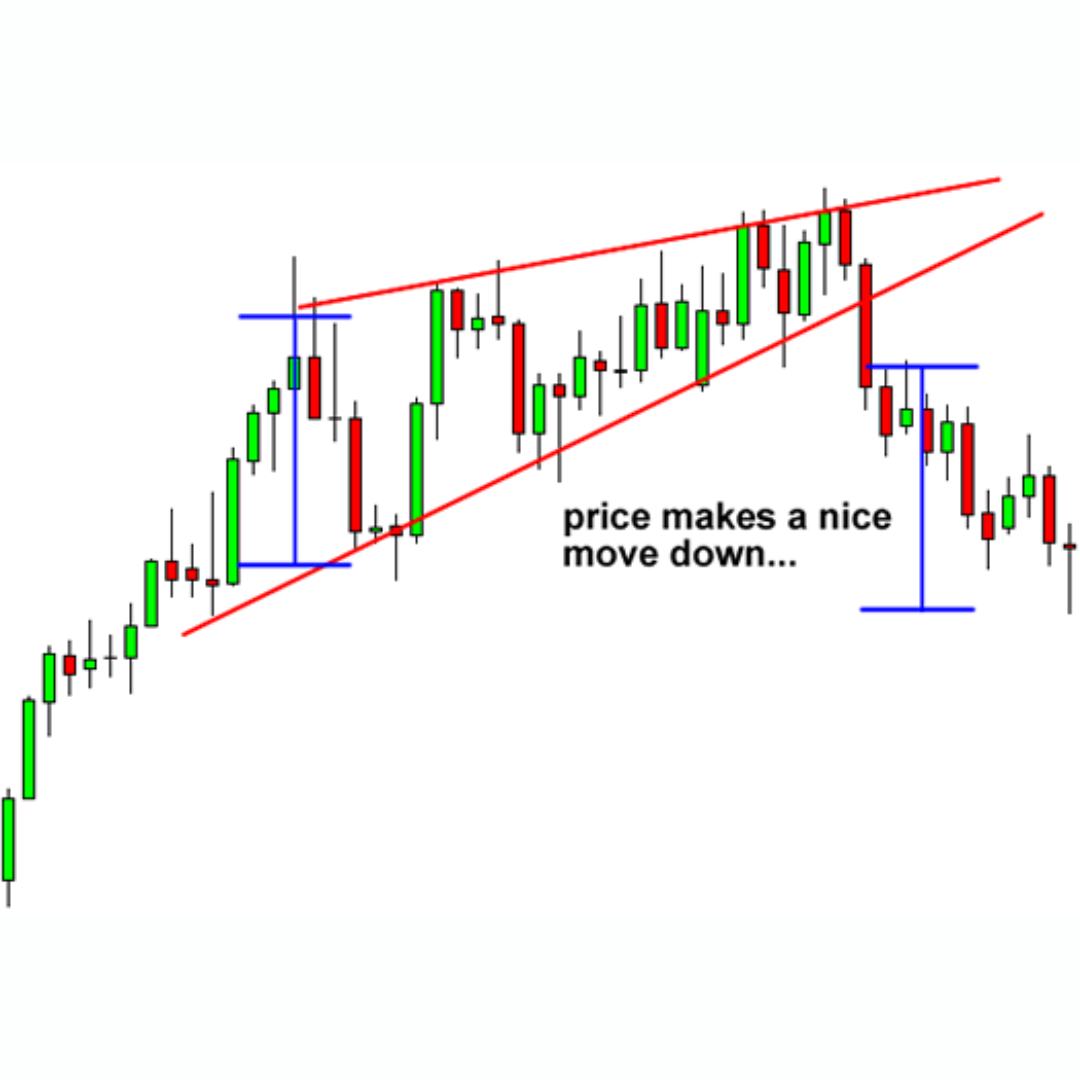
Later, the price breaks down to the downside because more traders want to short than want to buy. This makes the price drop below the trend line, which suggests that a downtrend is likely.
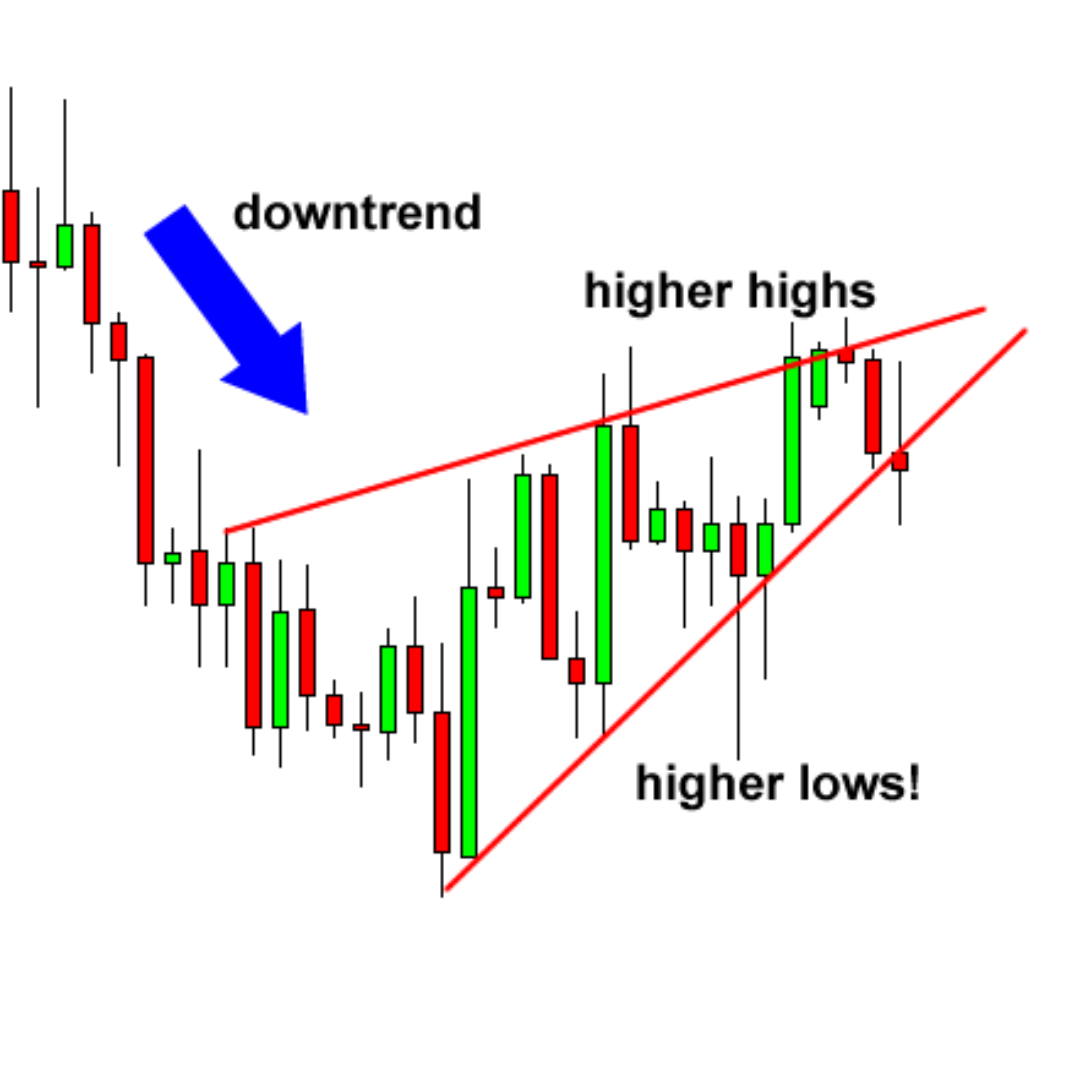
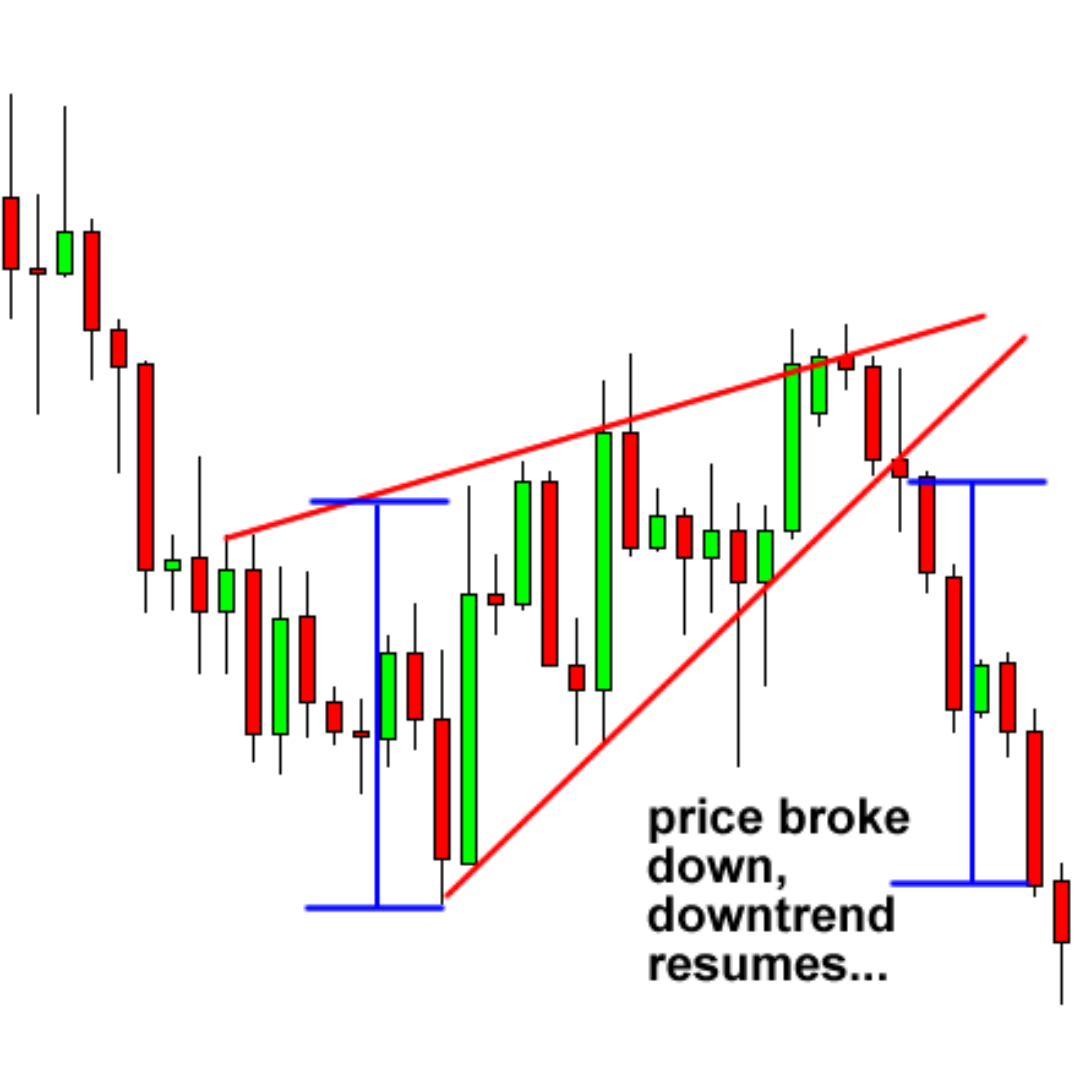
In the next example, the price was going down, but then it stopped and started to consolidate, making higher highs and even higher lows. It later broke down, and the trend kept going down.
Day traders use rising wedge patterns a lot, which can be useful at any time. When these patterns show up on price charts, it's been thought that it's a good sign that a change is coming.
But unlike some other patterns that are easier to understand, rising wedges can be hard to figure out because they can act in ways that aren't always clear.
So, traders who want to use rising wedge patterns to predict how prices will move in the future should pay close attention to how long they last and where they happen.
They should also use changes in volume and other technical indicators to confirm the moves they seem to be signaling.
They need to use a stop loss to protect themselves from the effects of false signals and be ready to quickly change their strategies if things change.
|
HOT TOPICS |
|
 |
|
 |
How Should You Trade The GBP/USD On October 14th? Simple Pointers For Newcomers |
 |


 AssetsFX